Stats Whisper, the stats gatherer
A few months ago I needed a simple tool that would gather certain app stats and integrate with our Rails apps easily. The underlying requirements were:
- collect visits counter and/or response time of given part of app;
- measure only certain (the most interesting) parts of app, e.g. concrete component or path, because the overall stats view is easily affordable with Google Analytics so additional toolset (collector, storage and visualization) sounds like an overhead.
Meet Stats Whisper
So I’ve created the Stats Whisper, a simple data gatherer for StatsD. StatsD, because of counters and timers data types, support for UDP packets and Graphite integration – we’re using it internally as data storage.
From Rails perspective, Stats Whisper is a middleware, which interacts with each request and gather data according to whisper_config.yml config file. Currently it can only provide a whitelist of which requests – or parts of app – have to be measured (time of execution in ms and counters for each route). The whitelist consists of regular expressions, e.g: ^/dashboard, matching only interesting requests. The message is being sent to StatsD (via UDP port) immediately once the request is completed.
It is essential to understand that the purpose of this library is to focus only on requests defined within whitelist. All the remaining are skipped, because it aims to measure only the most interesting parts of app, e.g. a concrete component – lets say user dashboard, product, a set of products or whatever is important to unleash the business value. Generally speaking, it’s up to the end user, what to measure and why.
The Stats Whisper library is not the only one on the market. I’m familiar with:
statsd-instrument, that can measure any app method execution time or count the amount of method invocation so it works even closer to the app than Stats Whisper;scout_statsd_rackwhich measures execution time and count of requests of any app path – it’s not possible to specify only certain paths.
A word about stats gathering
The aim of such measurements is to find anomalies that prevent the business from normal work. It is important to understand, what to measure and why. Start with critical components of your app, consider which parts might be the most important for the end user. The Stats Whisper library will help you gather appropriate statistics and identify bottlenecks. As an example, consider the chart shown below:
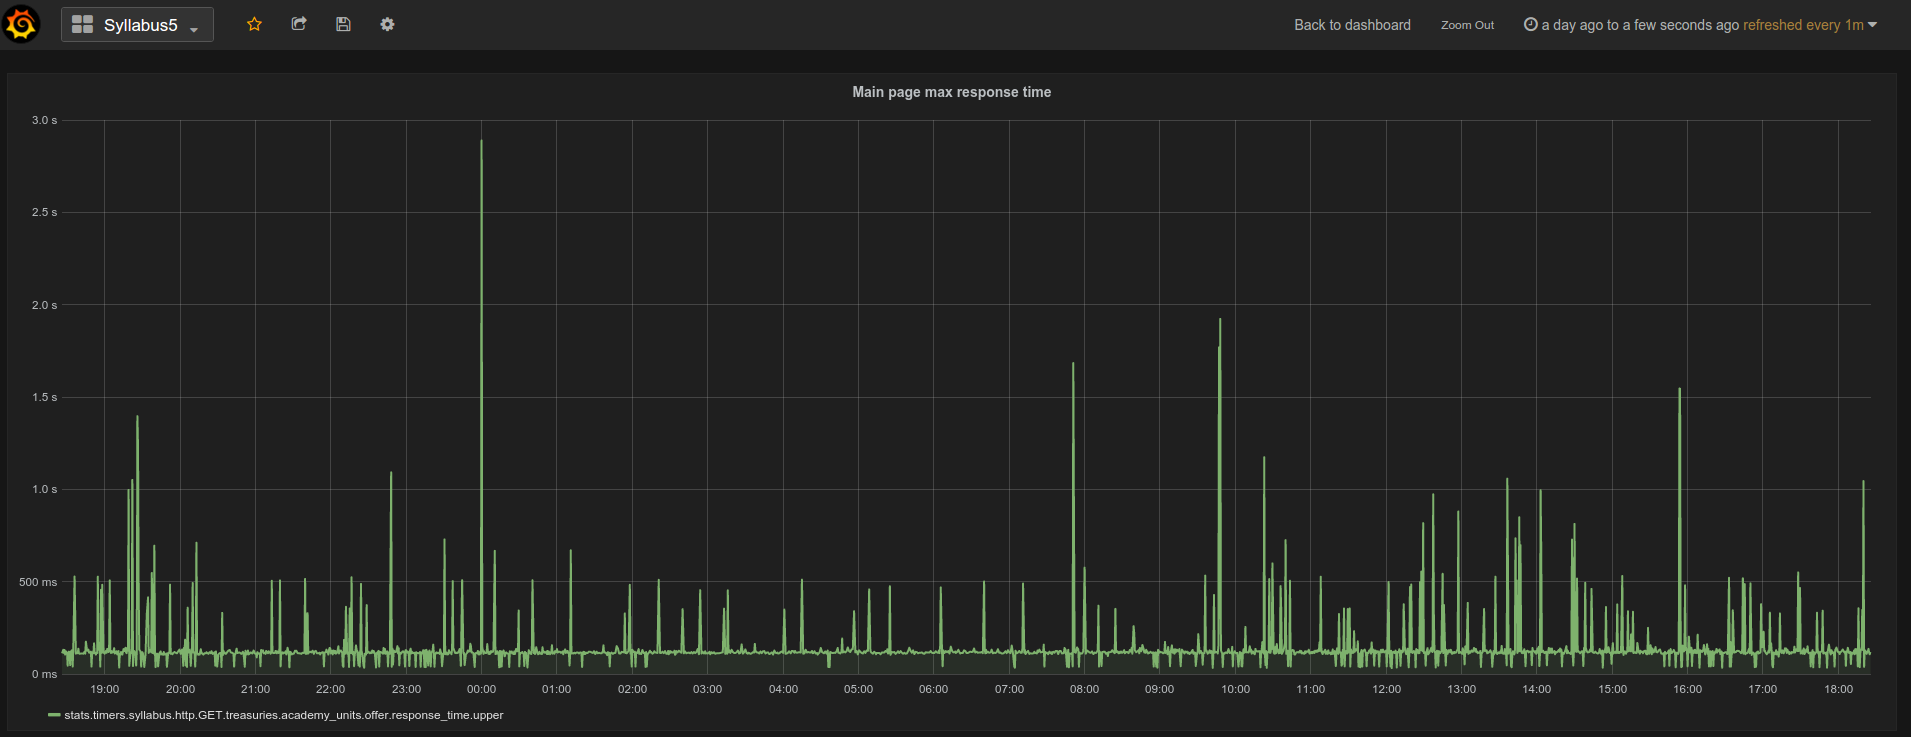
Understand the noise
“In average” (these quotes are on purpose) the response time is about 100ms per request, however sometimes it’s even order of magnitude bigger than the average. I’ve looked around and found that these peaks occur when user performs some search action, what was the bottleneck in this case.
Regarding quoted average phrase, note how StatsD computes its statistics values, especially timing data type. Be careful with these params, because they may get you inaccurate results. I mean they’re completely solid, but consider what mean or max offer and how these may change your point of view.
See interactions at peak performance
Another useful part of app statistics data analysis is the ability to unveil peak performance periods and how they interact e.g. with crucial components of the system while such events occur. See the chart shown below:
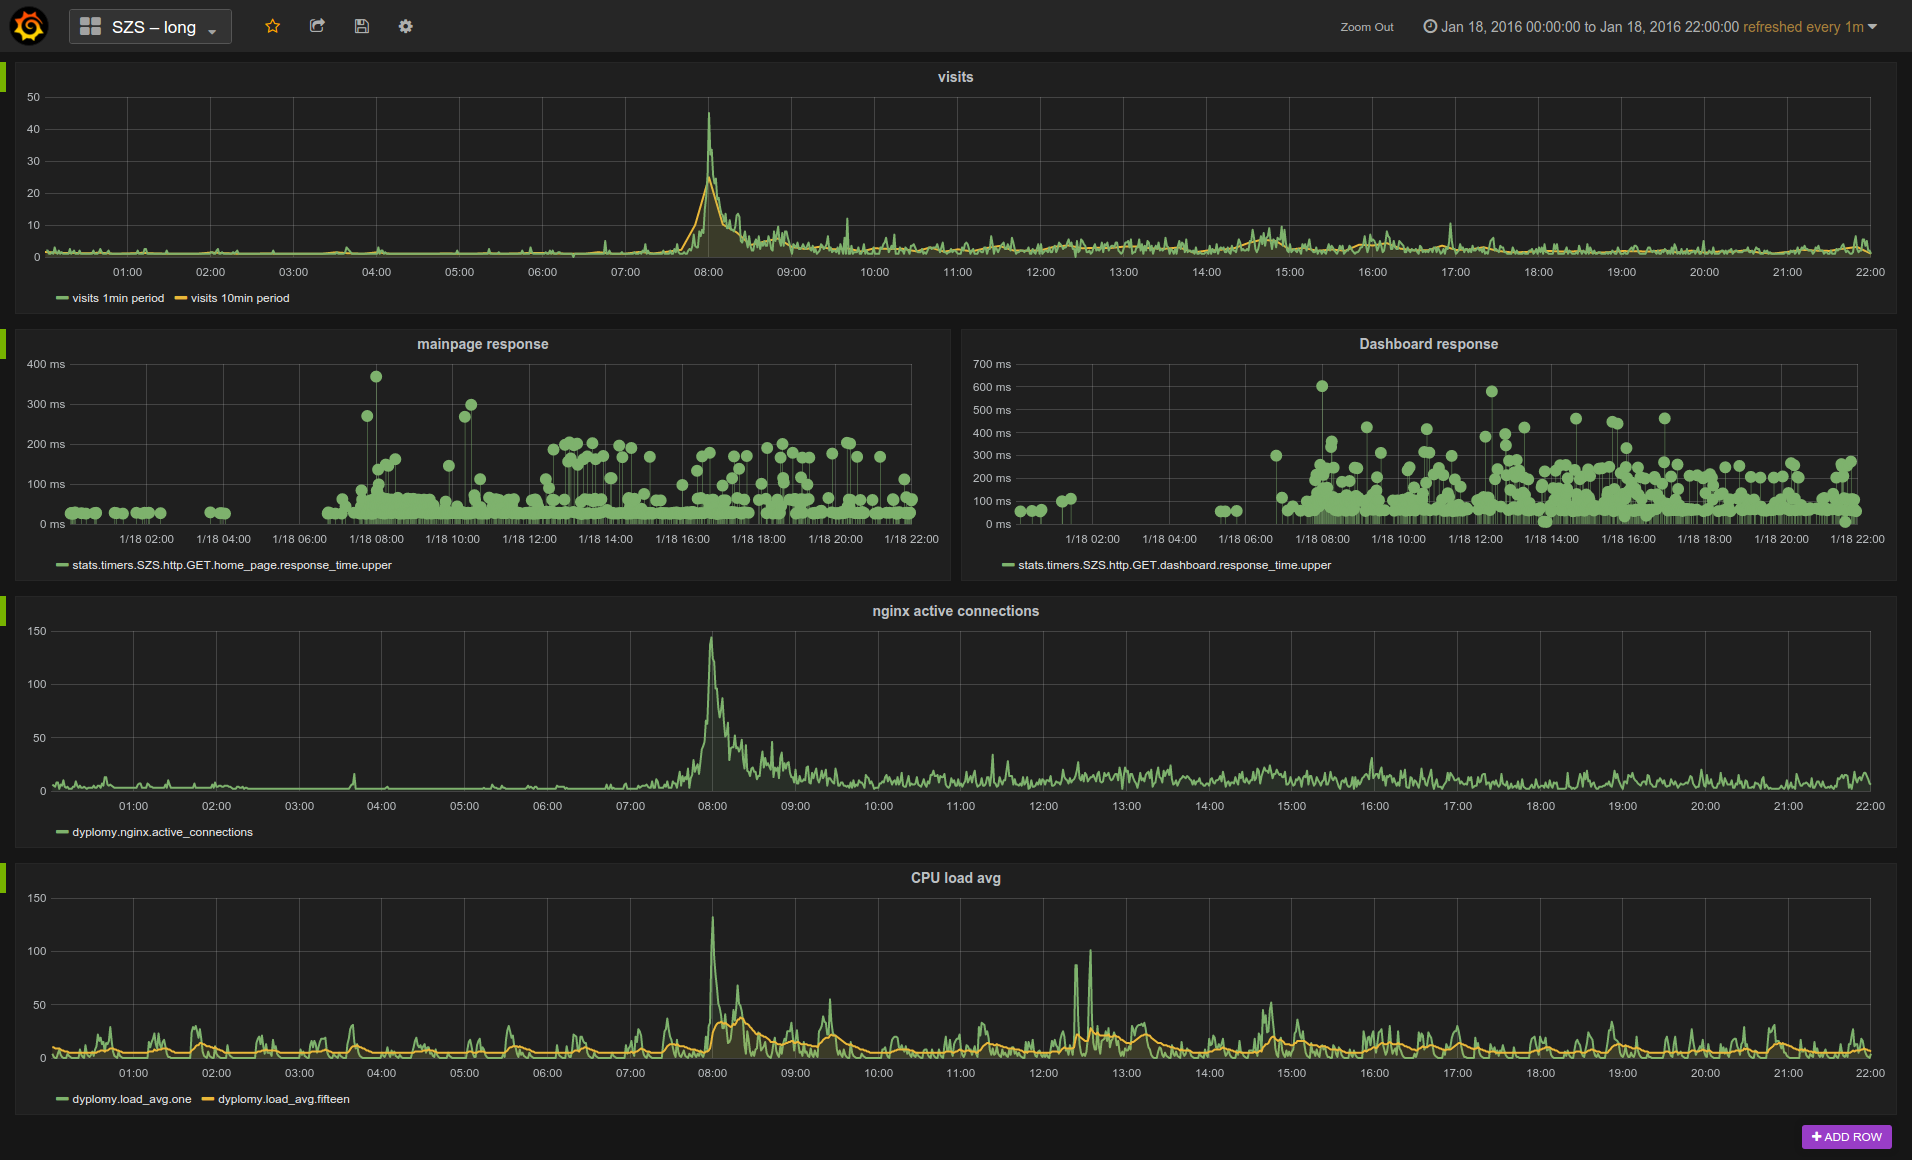
This is the real data gathered during students enrollments for elective courses. The enrollments started at 8 a.m. where the highest peak can be observed. Each student request response time has been measured and sent to StatsD counter and timer objects. The results are shown on first and second row. It’s worth noting that despite the peak performance, the upper (max value) of StatsD timer didn’t grew vast for main page and dashboard. I’ve also attached the CPU load avg to this chart to show it’s quite useless measurement, because note that it almost completely does not reflect the peak traffic – it does not tell you nothing about what is hapenning.